Viewing and Analysing POS Sales & Transactions
How to use Operations > Sales to review every transaction, filter by period, track revenue trends, and identify your best-selling products and busiest times.
Key Takeaways
- Operations > Sales shows every transaction with date, cashier, items sold, payment method, and total.
- Filter by date range, branch, cashier, or payment method to drill into exactly the data you need.
- The sales view shows both the transaction list and product-level summaries — use product summaries to find your bestsellers.
Opening the Sales view
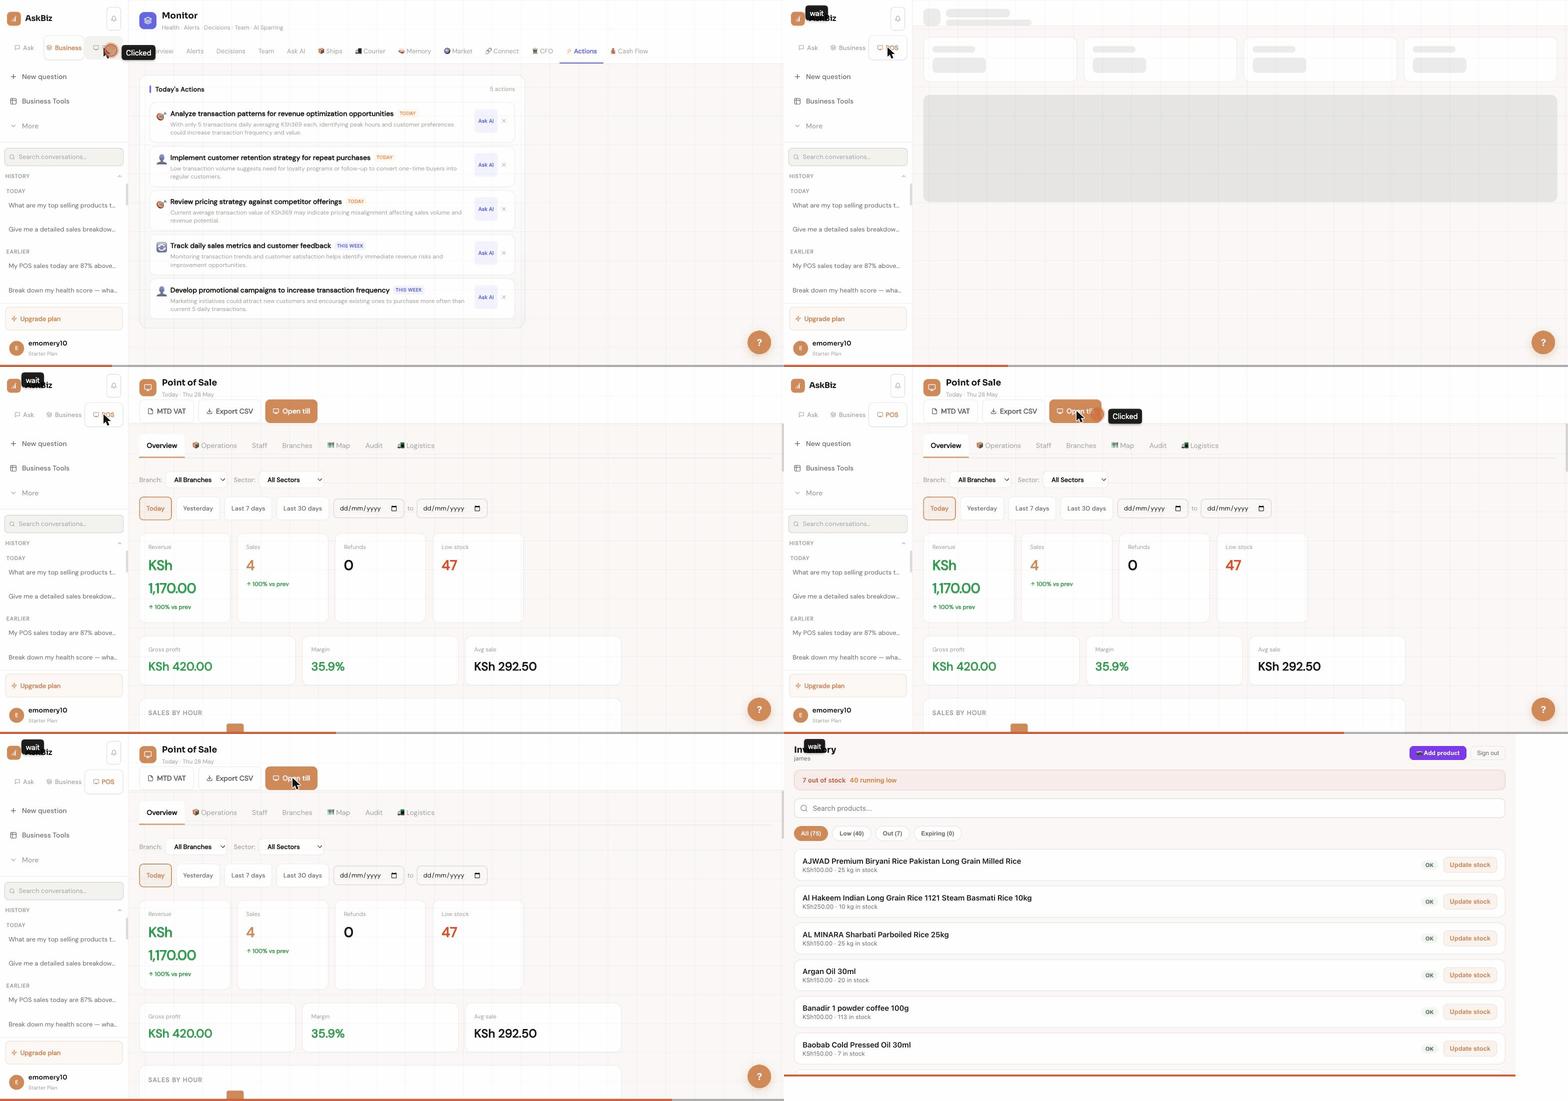
Go to POS > Operations > Retail > Sales. The Sales section shows Revenue and Transactions as headline numbers for your selected period, along with a chart of sales over time. Below that is a full transaction log. Each row shows the transaction date and time, the cashier who processed it, the items sold, the payment method (cash or card), and the total amount. Click any row to see the full receipt — every item, quantity, price, and any discount applied.
Filtering your sales data
Use the date range selector at the top to set the period. Combine this with the Branch dropdown to see sales for one location, or the cashier filter to see transactions by a specific staff member. The payment method filter lets you separate cash sales from card sales — useful when reconciling your card terminal against AskBiz. To export the filtered view, click Export CSV and the file downloads immediately with all visible columns.
Identifying your best-selling products
Switch to the Products tab within Sales to see a ranked list of items sold in the period. Each product shows total units sold, revenue generated, and its share of overall sales. Products at the top of the list deserve priority in your inventory planning — always keep generous stock of these. Products at the bottom that generate minimal revenue may be worth reviewing: consider whether they're priced correctly, positioned well, or worth stocking at all.
Understanding your sales patterns
The sales chart plots revenue over time. Look for peaks (busy days or hours) and troughs (slow periods). If you're on Last 7 days view, you might see that weekends consistently outperform weekdays, or that Tuesdays are your slowest day. Use this insight to plan staffing — schedule more cashiers during peak periods and fewer during slow ones. You can also correlate sales peaks with promotions or external events to understand what drives your busiest days.